Multi-Symbol Scanner: Advanced EMA-RSI-Volume Strategy# Multi-Symbol Tech Stock Scanner: Advanced EMA-RSI-Volume Strategy
## Technical Analysis Methodology
This scanner implements a sophisticated multi-timeframe analysis approach combining three key technical elements:
### 1. Dual EMA System (Primary Trend Detection)
- **Long-term EMA (820 periods)**: Acts as the primary trend identifier
- Chosen specifically for tech stocks' longer-term price waves
- Helps filter out minor market noise while capturing major trend changes
- 820 periods approximately represents 3.2 years of trading days
- **Medium-term EMA (320 periods)**: Serves as trend confirmation
- Approximately 1.25 years of trading data
- Provides earlier entry signals while maintaining trend reliability
- Helps identify potential trend reversals before the major trend shift
### 2. Volume Analysis Component
The script employs a dynamic volume analysis system:
- Calculates 20-period moving average of volume as baseline
- Requires 1.5x surge above baseline for signal confirmation
- Volume surge requirement helps filter out weak moves and potential false breakouts
- Different from standard volume indicators as it uses adaptive thresholds
### 3. RSI Momentum Filter
Implements a specialized RSI configuration:
- 14-period RSI with dynamic overbought/oversold levels
- Oversold threshold: 30 (customizable)
- Overbought threshold: 70 (customizable)
- Used as a confirmation tool rather than primary signal generator
## Signal Generation Logic
### Buy Signal Requirements
1. Price must cross above 820 EMA (PRIMARY CONDITION)
2. Current price must be above 320 EMA (CONFIRMATION)
3. RSI must be above 30 but below 70 (MOMENTUM CHECK)
4. Volume must be 1.5x above 20-period average (STRENGTH VALIDATION)
### Sell Signal Requirements
1. Price must cross below 820 EMA (PRIMARY CONDITION)
2. Current price must be below 320 EMA (CONFIRMATION)
3. RSI must be above 30 but below 70 (MOMENTUM CHECK)
4. Volume must be 1.5x above 20-period average (STRENGTH VALIDATION)
## Risk Management Integration
The script automatically calculates key risk levels based on volatility:
1. **Stop Loss Calculation**:
- Default: 2% below entry for buys
- Dynamically adjusted based on price point
- Can be modified through input parameters
2. **Take Profit Targets**:
- Primary target: 6% above entry (3:1 reward-risk ratio)
- Based on historical tech stock movement patterns
- Adjustable through input parameters
## Multi-Symbol Implementation
The scanner monitors 6 symbols simultaneously using:
- Separate security calls for each data point
- Optimized data requests to prevent overload
- Individual signal processing for each symbol
- Synchronized alert generation system
## Technical Implementation Details
1. **Data Processing**:
```
- Security data requests on 10-minute timeframe
- Individual EMA calculations per symbol
- Separate volume analysis threads
- RSI calculations with standard deviation normalization
```
2. **Signal Processing**:
```
- Cross-verification of all conditions
- Time-based signal validation
- Volume surge confirmation
- Trend alignment check
```
3. **Alert System**:
```
- Bar-close confirmation required
- Multi-condition validation
- Detailed price level inclusion
- Risk parameter integration
```
## Optimization Features
1. **Memory Usage**:
- Optimized security calls
- Efficient data structure
- Reduced redundant calculations
2. **Processing Efficiency**:
- Single-pass data analysis
- Combined indicator calculations
- Streamlined alert generation
## Practical Application
The system is designed for:
1. Swing Trading (primary use)
2. Position Trading (secondary use)
3. Technical Breakout Trading
Optimal timeframes:
- Primary: 4H charts
- Secondary: Daily charts
- Verification: 1H charts
## Default Configuration
The scanner is preset to monitor key tech stocks:
- TSLA: High-volatility tech leader
- NVDA: Semiconductor sector benchmark
- AVGO: Stable tech infrastructure
- TSM: Global chip manufacturer
- META: Social media sector leader
- AMZN: E-commerce/Cloud computing leader
Each symbol can be modified through input parameters.
## Version Information
- Current Version: 1.3
- Last Updated: November 2024
- Compatibility: TradingView Pro/Pro+/Premium
## Limitations & Considerations
- Limited to 6 symbols due to TradingView security request limits
- Requires consistent market volume for optimal performance
- Best suited for liquid stocks with significant daily volume
- May need parameter adjustments during extreme market conditions
Buscar en scripts para "volume indicator"

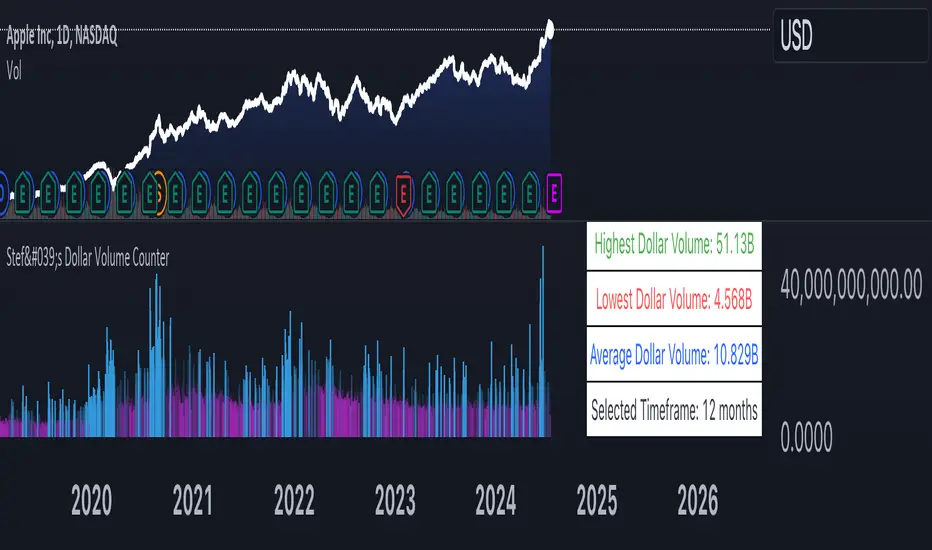
Stef's Dollar Volume CounterStef's Dollar Volume Counter is my second script that I've worked on and coded. I am proud of this script because it does something very, very important: it counts the AMOUNT of money traded, not just the amount shares/contracts traded. This is key for understanding where the big and small money is.
This script is totally different from other Volume scripts because it shows the amount of money traded, NOT the shares/contracts/coins etc. Also, more importantly, it is different from other volume indicators in the same space because this script is specifically focused on showcasing specific dollar volume amounts either as a table or as a label.
Here are the 5 key features you can utilize with this:
1. Customizable Gradient Colors for BIG money and SMALL money: Visually distinguishes between high and low dollar volumes. Change the colors as needed in the indicator settings menu.
2. Dollar Volume Counter Table: Positioned at the bottom right of the chart, this table provides quick insights into the highest, lowest, and average dollar volumes over a specified period. You can customize the time period in the settings menu.
3. "Wow! Much Money!" Labels: Highlights the top three recent highest dollar volumes within the visible chart area, emphasizing significant trading periods. Also, it's hilarious :)
4. Customize the period for volume analysis, ranging from 1 to 12 months or more, with the selected timeframe displayed in the table.
5. It opens as a new pane below the chart so that you can still analyze price and more, as needed.
Thanks for reading! I look forward to hearing your feedback. This script will be updated to expand on more concepts and I'll add some cool features soon.
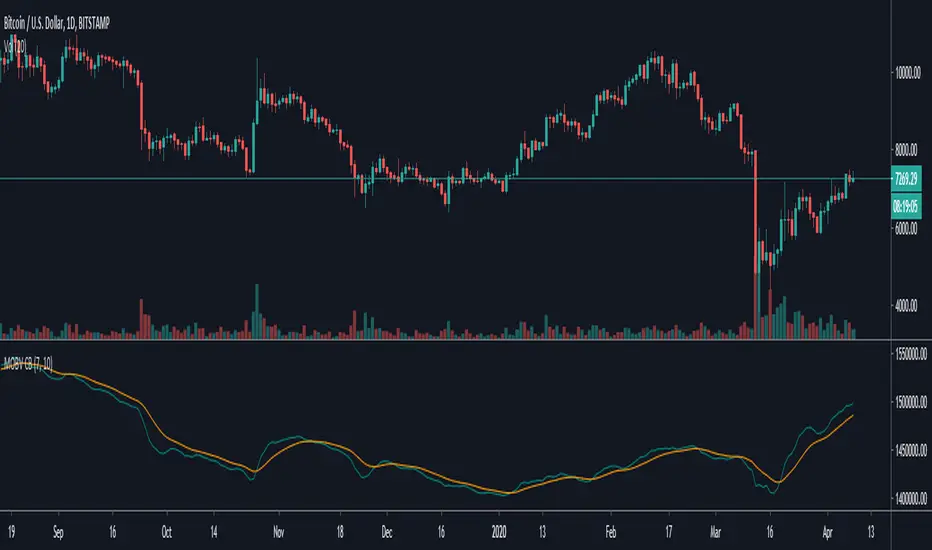
Klinger Oscillator AdvancedThe Klinger Oscillator is not fully implemented in Tradeview. While the description at de.tradingview.com is complete, the implementation is limited to the pure current volume movement. This results in no difference compared to the On Balance Volume indicator.
However, Klinger's goal was to incorporate the trend as volume force in its strength and duration into the calculation. The expression ((V x x T x 100)) for volume force only makes sense as an absolute value, which should probably be expressed as ((V x abs(2 x ((dm/cm) - 1)) x T x 100)). Additionally, there is a need to handle the theoretical possibility of cm == 0.
Since, in general, significantly more trading volume occurs at the closing price than during the day, an additional parameter for weighting the closing price is implemented. In intraday charts, considering the closing price, in my opinion, does not make sense.
The TradeView implementation is displayed on the chart for comparison. Particularly in the analysis of divergence, significant deviations become apparent.

[VWMA] Net Volume LibraryLibrary " Net Volume Library"
TODO: The underlying logic and function that calculates the net volume for the Net Volume indicator. Exposes the nv function and nvPoint fields for use.
nv(src, length, useVwma, offset, sigma, multHigh, multMed, multLow)
Parameters:
src : (float) The source price value
length : (int) The lookback length
useVwma : (bool) To use VWMA in the calculation or not
offset : (float) The ALMA offset value
sigma : (int) The ALMA sigma value
multHigh : (float) The multiplier high band
multMed : (float) The multiplier medium band
multLow : (float) The multiplier low band
Returns: Returns the calculated net volume for each band in an nvPoint object
nvPoint
Fields:
h2
h1
h
n
l
l1
l2

Stochastic Slow and OBV Percent Oscillator
Purpose - Stochastic is the best momentum indicator and On Balance Volume (OBV) is the best volume indicator. Why not combine both to come up with a more sophisticated oscillator?
How It's Done - I had to put OBV as an oscillator (returning values between 0 and 100) in order to put it in the same pane with the slow stochastic oscillator. Otherwise, their synergy won't be that great. So, I have decided to visualize OBV as a percentage relative to selected period's high and low value. That way, I can keep the OBV value to stay within boundary.
Interpretation
1. Dot color indicates the whether the stochastic K/OBV is over or below the stochastic D/Signal line.
2. When Stoch and OBV are moving in the same direction and are close together (on top of each other), this indicates a strong trend
3. When Stoch crosses up or down the OBV oscillator, it may indicate a trend reversal

Volume & Highlights
Large or small volume bars are highlighted.
Normal bars are using the same colors as the built-in volume indicator.

Kifier's MFI/STOCH Hidden Divergence/Trend BeaterMFI/STOCH Hidden Divergence/Trend Beater
General Idea:
My premise around this strategy was to make a general strategy for crypto that would help out with finding entry positions for when you’re bullish on a crypto and want to hold on for a while, and at the same time avoiding massive drops. Essentially a way to mix long term/ swing trading; I somewhat achieved my goal however it still requires a lot of logic tuning of the trend averages.
I’m a huge proponent of volume indicators and coupled with average closing price, I think this gives a really good idea of what is happening with the market. It gives an idea on the market and retail investor sentiment. This generally gives you logical entry positions (Although I don’t know how amazing that will work with all cryptos, there’s a fine line between a good strategy and one that just rides bubble market conditions, some would argue that’s still a success and others not)
How it works:
There are many components to the strategy that try to do different things:
First of all there are two types of entries, a MFI hidden divergence with a STOCH check, essentially it will only fire when a divergence is detected while STOCH is above 50%, however this might be changed in the future as due to the volatile nature of cryptos, the STOCH is not too effective. The second entry is a simple MFI/STOCH trend, if STOCH is above 50% and the trend is detected to be in a trending long, once a MFI crossover over the 50% line is detected an entry is placed, this is designed to get out profit where the divergence would otherwise be less accurate during strongly trending conditions.
-MFI is a great indicator, as a volume weighted momentum indicator I find it the most accurate of all, the STOCH however is a great indicator to get a general picture of simple market conditions and can filter out the emotional noise of retail investors.
-VWMA and an SMA (The bottom oscillator) gives an idea of the trend tacking into account of the volume, this serves as a more short term filter of the trend for filters.
-OBV checks are done between the OBV and an EMA of the OBV, to get the idea of a volume weighted long trend, which is important for crypto as there are massive rallies to go up due to retail greed, it’s great to jump onto it at the beginning, and get off before the stack of cards fall apart.
-ATR is used to detect when the market is relatively just ranging or moving sideways, which is where the hidden divergence entries are done, during predictable and profitable market conditions.
- Stop loss is based on the closest support of the entry, this is a nice medium of room to breath but also an actual stop loss.
Future plans and improvements:
Currently there’s a lot I want to improve, mostly the divergence detection and the overall sharpe ratio could be much better, but the current value of 0.5 gives me hope that the strategy is onto something. I also want to change TP from a percentage stop to something more dynamic but that might be too optimistic. The current plan is to paper trade test this either by manual or by a python bot, to see how it performs with some user input as well.

[ENG/PL] Sumiński's Volume | Wolumen SumińskiegoNASDAQ:DISCK ENG below.
Niniejszy wskaźnik, który jako jego twórca pozwoliłem sobie nazwać w tłumaczeniu na Polski - Wolumenem Sumińskiego :)
Od innych wskaźników wolumenu różni się tym, że mierzy "gęstość wolumenu" na danym barze. Polega to na tym, że w przypadku wystąpienia dużej świecy, np. spadkowej przy niewielkim wolumenie - oznacza to że wskazany obszar cenowy pozbawiony jest drugiej strony - w tym przypadku kupujących, nie zachodzi tu chęć odkupienia sprzedawanego instrumentu.
Jednak w przypadku wystąpienia niedużej świecy, a podwyższonego wolumenu - oznacza to, że przy danym poziomie ceny spotkał się duży kapitał kupujących i sprzedających - wskaźnik oznacza taki bar wysoką wartością. Im wyższy poziom wskaźnika tym "gęstsza" i mocniejsza wymiana pomiędzy kupującymi a sprzedającymi.
_____________________________________________
This indicator, which, as its creator, I have allowed myself to call - Sumiński's Volume :)
It differs from other volume indicators in that it measures the "volume density" on a given bar. It consists in the fact that in the event of a large candle, e.g. a downward candle with a small volume - it means that the indicated price area has no other side - in this case there are buyers, there is no desire to buy back the instrument being sold.
However, in the event of a small candle and an increased volume - this means that at a given price level, there was a large capital of buyers and sellers - the indicator means such a bar with a high value. The higher the index level, the "denser" and stronger the exchange between buyers and sellers.

Keltner + RSI Bitcoin Futures Trading [luca_badoer]This indicator combines the power of the Keltner channel with the power of the Relative Strength Indicator (RSI). It can help understand when the market is entering a bullish or a bearish trend.
Normally a Keltner channel would reference an Exponential Moving Average (EMA) of the price. In this case the Keltner Channel in the "Keltner + RSI Bitcoin Futures Trading " references the EMA of the 14-day RSI (white line). On top of that it overlays a 7-day RSI line (blue line). This produces some signals that are particularly useful in 2h, 4h and 1 day charts. The signals consist in the 7-day RSI line (blue line) crossing the upper (green) or lower (red) Keltner channels as well as the middle (white) line. Depending on the direction of the crossing (up or down) and the RSI level (from 0 to 100) at which the crossing takes place this produces bullish or bearish signals.
Examples:
- Bullish crossing: 7-day RSI (blue) crosses both the lower (red) and middle (white) lines upwards at a low to neutral RSI level (<70%)
- Bearish crossing: 7-day RSI (blue) cross both the upper (green) and middle (white) lines downwards at a high to neutral RSI (>30%)
Recommendations:
- Better to use it in 2h, 4h, and 1-day charts, thought it can also be used in lower timeframes. Confirmations of crossings in higher time-frames provide more certainty about the direction of the move.
- Use in combination with Heikin Ashi candles and volume indicators.

Price Volume Strength ComparatorBollinger bands says whether price or any source is relatively high or low at any particular point of time. We can apply Bollinger bands on RSI and volume indicator Price Volume Trend to identify if RSI movement or PVT movement is relatively high or low.
By calculating Bollinger %B, we can define the variation in a range between 0 to 1. By applying Bollinger %B on price, volume and strength, we are trying to compare how much they differ relative to each other.
For example, if Bollinger %B of volume is higher than Bollinger %B of price, which may mean, we can still expect continuation of upward movement. If volume %B is lesser, we can interpret this as price has moved more than the volume and may retrace back.
Note: I tried adding multiple volume/strength indicators as input choice. But, if condition did not work with simple string. Have no idea why. I will try adding that later if more people show interest.

Volume Divergence by MMIt's a simply volume indicator. You should watch for breaks on both volume uptrend and volume downtrend. It uses fibonacci numbers to build smoothed moving average of volume.
Also you can check divergences for trend reversal and momentum loss.

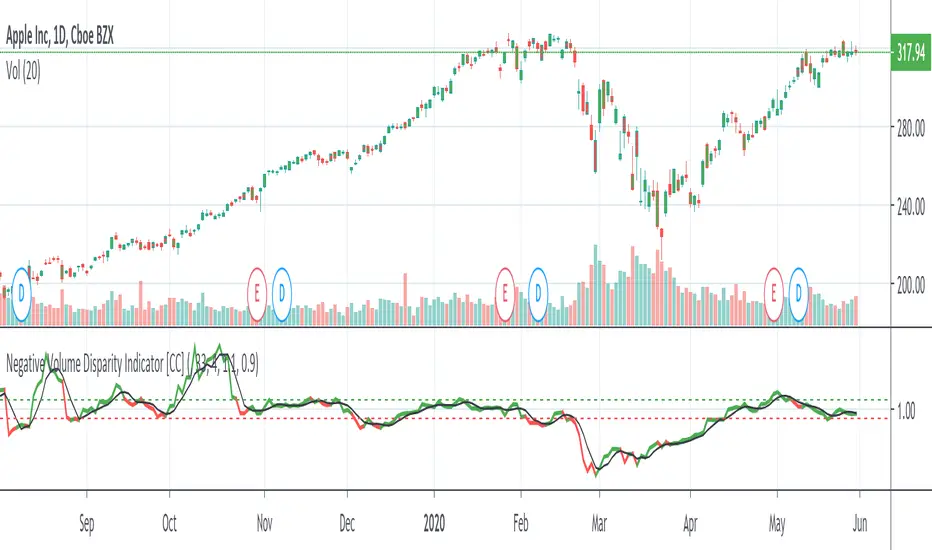
Negative Volume Disparity IndicatorThe Negative Volume Disparity Indicator was created by Phillip C. Holt (Stocks & Commodities V. 14:6 (265-269)). This converts the classic Negative Volume indicator into Bollinger Bands and calculates the percentage of where the value lies within the Bollinger Bands. Buy when the nvdi rises above its signal line and sell when it falls below the signal line.
The OBVDI was a special request so I figured I would add this one as well. Let me know what other indicators you would like me to write scripts for!
Volume xSMA ModSimple Volume indicator. showing rounded ratio of Current volume and simple moving average as xSMA (read as times SMA).
Quick metric to understand the impact of volume in trends, etc.
Example:
if Vol = 50 and SMA = 5
xSMA = 50/5 = 10
Indicated as the Third Number in Volume label.

Modified version of On-Balance Volume [ChuckBanger]This is a smoothed version of the classic On-Balance Volume indicator. And I added a signal line with alerts that the user can set through TradingViews alert panel to indicate long or short play. I also find that this indicator is good to do divergences analysis on the asset you want to trade.
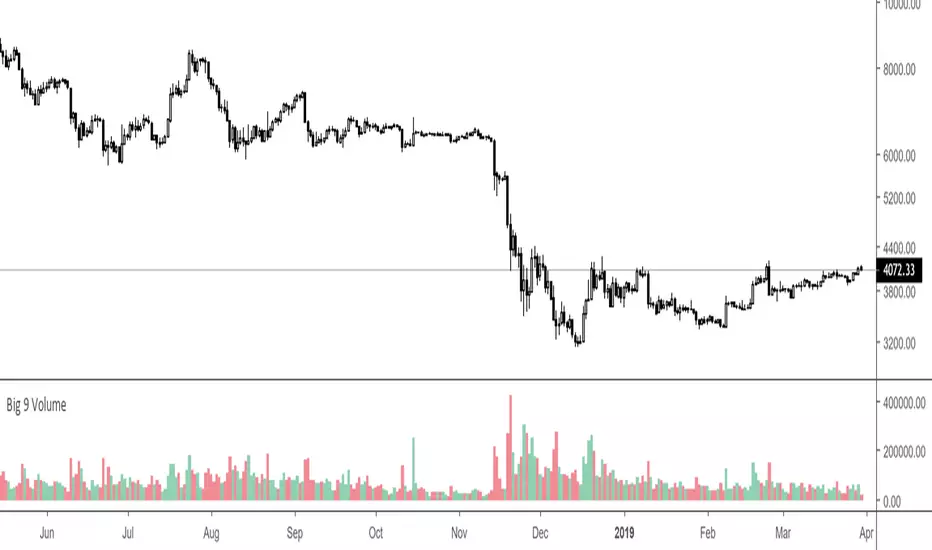
Big 9 Volume - Volume indicator from exchanges with real volumeHere is a very basic indicator combining the volumes of the 9 biggest exchanges trading BTC/USD or BTC/USDT. These 9 exchanges were chosen based on the report by Bitwise Invest stating that 95% of the volume on CoinMarketCap is fake. On these 9 exchanges, however, volume data appears to be reliable. Please note BitFlyer was not included because it does not trade in USD. Please note also that data on all 9 exchanges is only available from June 2018.
Anyone is welcome to modify this and make it more elegant, this was just a quick implementation.
Calm before the StormCalm before the Storm - Bollinger Bands Volatility Indicator
What It Does
This indicator identifies and highlights periods of extremely low market volatility by analyzing Bollinger Bands distance. It uses percentile-based analysis to find the "quietest" market periods and highlights them with a gradient background, operating on the premise that low volatility periods often precede significant price movements.
How It Works
Volatility Measurement: Calculates the distance between Bollinger Bands upper and lower boundaries
Percentile Analysis: Analyzes the lowest X% of volatility periods over a configurable lookback period (default: lowest 40% over 200 bars)
Visual Highlighting: Uses gradient opacity to show volatility levels - the lower the volatility, the more opaque the background highlighting
Adaptive Threshold: Automatically calculates what constitutes "low volatility" based on recent market conditions
Who Should Use It
Primary Users:
Breakout Traders: Looking for consolidation periods that may precede significant moves
Options Traders: Seeking low implied volatility periods before volatility expansion
Swing Traders: Identifying accumulation/distribution phases before trend continuation or reversal
Range Traders: Spotting tight trading ranges for mean reversion strategies
Trading Styles:
Volatility-based strategies
Breakout and momentum trading
Options strategies (volatility plays)
Market timing approaches
When to Use It
Market Conditions:
Consolidation Phases: When price is moving sideways with decreasing volatility
Pre-Announcement Periods: Before earnings, economic data, or major events
Market Transitions: During shifts between trending and ranging markets
Low Volume Periods: When institutional participation is reduced
Strategic Applications:
Entry Timing: Wait for volatility compression before positioning for breakouts
Risk Management: Reduce position sizes during highlighted periods (anticipating volatility expansion)
Options Strategy: Sell premium during low volatility, buy during expansion
Multi-Timeframe Analysis: Combine with higher timeframe trends for confluence
Key Benefits
Objective Volatility Measurement: Removes subjectivity from identifying "quiet" markets
Adaptive Analysis: Automatically adjusts to current market conditions
Visual Clarity: Easy-to-interpret gradient highlighting
Customizable Sensitivity: Adjustable percentile thresholds for different trading styles
Best Used In Combination With:
Trend analysis tools
Support/resistance levels
Volume indicators
Momentum oscillators
This indicator is particularly valuable for traders who understand that periods of low volatility are often followed by periods of high volatility, allowing them to position ahead of potential significant price movements.
Volumetric Entropy IndexVolumetric Entropy Index (VEI)
A volume-based drift analyzer that captures directional pressure, trend agreement, and entropy structure using smoothed volume flows.
---
🧠 What It Does:
• Volume Drift EMAs : Shows buy/sell pressure momentum with adaptive smoothing.
• Dynamic Bands : Bollinger-style volatility wrappers react to expanding/contracting drift.
• Baseline Envelope : Clean structural white rails for mean-reversion zones or trend momentum.
• Background Shading : Highlights when both sides (up & down drift) are in agreement — green for bullish, red for bearish.
• Alerts Included : Drift alignment, crossover events, net drift shifts, and strength spikes.
---
🔍 What Makes It Different:
• Most volume indicators rely on bars, oscillators, or OBV-style accumulation — this doesn’t.
• It compares directional EMAs of raw volume to isolate real-time bias and acceleration.
• It visualizes the twisting tension between volume forces — not just price reaction.
• Designed to show when volatility is building inside the volume mechanics before price follows.
• Modular — every element is optional, so you can run it lean or fully loaded.
---
📊 How to Use It:
• Drift EMAs : Watch for one side consistently dominating — sharp spikes often precede breakouts.
• Bands : When they tighten and start expanding, it often signals directional momentum forming.
• Envelope Lines : Use as high-probability reversal or continuation zones. Bands crossing envelopes = potential thrust.
• Background Color : Green/red backgrounds confirm volume agreement. Can be used as a filter for other signals.
• Net Drift : Optional smoothed oscillator showing the difference between bullish and bearish volume pressure. Crosses above or below zero signal directional bias shifts.
• Drift Strength : Measures pressure buildup — spikes often correlate with large moves.
---
⚙️ Full Customization:
• Turn every layer on/off independently
• Modify all colors, transparencies, and line widths
• Adjust band width multiplier and envelope offset (%)
• Toggle bonus plots like drift strength and net baseline
---
🧪 Experimental Tools:
• Smoothed Net Drift trace
• Drift Strength signal
• Envelope lines and dynamic entropy bands with adjustable math
---
Built for signal refinement. Made to expose directional imbalance before the herd sees it.
Created by @Sherlock_Macgyver

Pullback Setup HelperThe Pullback Setup Helper is a visual tool designed to assist traders in identifying high-probability pullback entry zones in both bullish and bearish trends. It dynamically calculates support and resistance pullback areas using a combination of recent price extremes and ATR-based volatility measures.
The indicator plots two main zones: one for potential long setups beneath recent highs, and another for short setups above recent lows. These zones are derived from configurable multipliers of the ATR to define depth and width, with an additional buffer to allow for slight overshoots or market noise.
Signals are generated when price enters a pullback zone and closes in the direction of the trend, using a relaxed condition (close > previous close for longs, close < previous close for shorts) to increase signal frequency. Entry signals appear as triangles on the chart, with optional alerts available for both long and short scenarios.
This tool is best used as a contextual guide to support trend-continuation trades, particularly when combined with additional confirmation from momentum or volume indicators.

QuantumSync Pulse [ w.aritas ]QuantumSync Pulse (QSP) is an advanced technical indicator crafted for traders seeking a dynamic and adaptable tool to analyze diverse market conditions. By integrating momentum, mean reversion, and regime detection with quantum-inspired calculations and entropy analysis, QSP offers a powerful histogram that reflects trend strength and market uncertainty. With multi-timeframe synchronization, adaptive filtering, and customizable visualization, it’s a versatile addition to any trading strategy.
Key Features
Hybrid Signals: Combines momentum and mean reversion, dynamically weighted by market regime.
Quantum Tunneling: Enhances responsiveness in volatile markets using volatility-adjusted calculations.
3-State Entropy: Assesses market uncertainty across up, down, and neutral states.
Regime Detection: Adapts signal weights with Hurst exponent and volatility ROC.
Multi-Timeframe Alignment: Syncs with higher timeframe trends for context.
Customizable Histogram: Displays trend strength with ADX-based visuals and flexible styling.
How to Use and Interpret
Histogram Interpretation
Positive (Above Zero): Bullish momentum; color intensity shows trend strength.
Negative (Below Zero): Bearish momentum; gradients indicate weakness.
Overlaps: Alignment of final_z (signal) and ohlc4 (price) histograms highlights key price levels or turning points.
Regime Visualization
Green Background: Trending market; prioritize momentum signals.
Red Background: Mean-reverting market; focus on reversion signals.
Blue Background: Neutral state; balance both signal types.
Trading Signals
Buy: Histogram crosses above zero or shows positive divergence between histograms.
Sell: Histogram crosses below zero or exhibits negative divergence.
Confirmation: Match signals with regime background—green for trends, red for ranges.
Customization
Tweak Momentum Length, Entropy Lookback, and Hurst Exponent Lookback for sensitivity.
Adjust color themes and transparency to suit your charts.
Tips for Optimal Use
Timeframes: Use higher timeframes (1h, 4h) for trend context and lower (5m, 15m) for entries.
Pairing: Combine with RSI, MACD, or volume indicators for confirmation.
Backtesting: Test settings on historical data for asset-specific optimization.
Overlaps: Watch for histogram overlaps to identify support, resistance, or reversals.
Simulated Performance
Trending Markets: Histogram stays above/below zero, with overlaps at retracements for entries.
Range-Bound Markets: Oscillates around zero; overlaps signal reversals in red regimes.
Volatile Markets: Quantum tunneling ensures quick reactions, with filters reducing noise.
Elevate your trading with QuantumSync Pulse—a sophisticated tool that adapts to the market’s rhythm and your unique style.

Aurora Flow Oscillator [QuantAlgo]The Aurora Flow Oscillator is an advanced momentum-based technical indicator designed to identify market direction, momentum shifts, and potential reversal zones using adaptive filtering techniques. It visualizes price momentum through a dynamic oscillator that quantifies trend strength and direction, helping traders and investors recognize momentum shifts and trading opportunities across various timeframes and asset class.
🟢 Technical Foundation
The Aurora Flow Oscillator employs a sophisticated mathematical approach with adaptive momentum filtering to analyze market conditions, including:
Price-Based Momentum Calculation: Calculates logarithmic price changes to measure the rate and magnitude of market movement
Adaptive Momentum Filtering: Applies an advanced filtering algorithm to smooth momentum calculations while preserving important signals
Acceleration Analysis: Incorporates momentum acceleration to identify shifts in market direction before they become obvious
Signal Normalization: Automatically scales the oscillator output to a range between -100 and 100 for consistent interpretation across different market conditions
The indicator processes price data through multiple filtering stages, applying mathematical principles including exponential smoothing with adaptive coefficients. This creates an oscillator that dynamically adjusts to market volatility while maintaining responsiveness to genuine trend changes.
🟢 Key Features & Signals
1. Momentum Flow and Extreme Zone Identification
The oscillator presents market momentum through an intuitive visual display that clearly indicates both direction and strength:
Above Zero: Indicates positive momentum and potential bullish conditions
Below Zero: Indicates negative momentum and potential bearish conditions
Slope Direction: The angle and direction of the oscillator provide immediate insight into momentum strength
Zero Line Crossings: Signal potential trend changes and new directional momentum
The indicator also identifies potential overbought and oversold market conditions through extreme zone markings:
Upper Zone (>50): Indicates strong bullish momentum that may be approaching exhaustion
Lower Zone (<-50): Indicates strong bearish momentum that may be approaching exhaustion
Extreme Boundaries (±95): Mark potentially unsustainable momentum levels where reversals become increasingly likely
These zones are displayed with gradient intensity that increases as the oscillator moves toward extremes, helping traders and investors:
→ Identify potential reversal zones
→ Determine appropriate entry and exit points
→ Gauge overall market sentiment strength
2. Customizable Trading Style Presets
The Aurora Flow Oscillator offers pre-configured settings for different trading approaches:
Default (80,150): Balanced configuration suitable for most trading and investing situations.
Scalping (5,80): Highly responsive settings for ultra-short-term trades. Generates frequent signals and catches quick price movements. Best for 1-15min charts when making many trades per day.
Day Trading (8,120): Optimized for intraday movements with faster response than default settings while maintaining reasonable signal quality. Ideal for 5-60min or 4h-12h timeframes.
Swing Trading (10,200): Designed for multi-day positions with stronger noise filtering. Focuses on capturing larger price swings while avoiding minor fluctuations. Works best on 1-4h and daily charts.
Position Trading (14,250): For longer-term position traders/investors seeking significant market trends. Reduces false signals by heavily filtering market noise. Ideal for daily or even weekly charts.
Trend Following (16,300): Maximum smoothing that prioritizes established directional movements over short-term fluctuations. Best used on daily and weekly charts, but can also be used for lower timeframe trading.
Countertrend (7,100): Tuned to detect potential reversals and exhaustion points in trends. More sensitive to momentum shifts than other presets. Effective on 15min-4h charts, as well as daily and weekly charts.
Each preset automatically adjusts internal parameters for optimal performance in the selected trading context, providing flexibility across different market approaches without requiring complex manual configuration.
🟢 Practical Usage Tips
1/ Trend Analysis and Interpretation
→ Direction Assessment: Evaluate the oscillator's position relative to zero to determine underlying momentum bias
→ Momentum Strength: Measure the oscillator's distance from zero within the -100 to +100 range to quantify momentum magnitude
→ Trend Consistency: Monitor the oscillator's path for sustained directional movement without frequent zero-line crossings
→ Reversal Detection: Watch for oscillator divergence from price and deceleration of movement when approaching extreme zones
2/ Signal Generation Strategies
Depending on your trading approach, multiple signal strategies can be employed:
Trend Following Signals:
Enter long positions when the oscillator crosses above zero
Enter short positions when the oscillator crosses below zero
Add to positions on pullbacks while maintaining the overall trend direction
Countertrend Signals:
Look for potential reversals when the oscillator reaches extreme zones (±95)
Enter contrary positions when momentum shows signs of exhaustion
Use oscillator divergence with price as additional confirmation
Momentum Shift Signals:
Enter positions when oscillator changes direction after establishing a trend
Exit positions when oscillator direction reverses against your position
Scale position size based on oscillator strength percentage
3/ Timeframe Optimization
The indicator can be effectively applied across different timeframes with these considerations:
Lower Timeframes (1-15min):
Use Scalping or Day Trading presets
Focus on quick momentum shifts and zero-line crossings
Be cautious of noise in extreme market conditions
Medium Timeframes (30min-4h):
Use Default or Swing Trading presets
Look for established trends and potential reversal zones
Combine with support/resistance analysis for entry/exit precision
Higher Timeframes (Daily+):
Use Position Trading or Trend Following presets
Focus on major trend identification and long-term positioning
Use extreme zones for position management rather than immediate reversals
🟢 Pro Tips
Price Momentum Period:
→ Lower values (5-7) increase sensitivity to minor price fluctuations but capture more market noise
→ Higher values (10-16) emphasize sustained momentum shifts at the cost of delayed response
→ Adjust based on your timeframe (lower for shorter timeframes, higher for longer timeframes)
Oscillator Filter Period:
→ Lower values (80-120) produce more frequent directional changes and earlier response to momentum shifts
→ Higher values (200-300) filter out shorter-term fluctuations to highlight dominant market cycles
→ Match to your typical holding period (shorter holding time = lower filter values)
Multi-Timeframe Analysis:
→ Compare oscillator readings across different timeframes for confluence
→ Look for alignment between higher and lower timeframe signals
→ Use higher timeframe for trend direction, lower for earlier entries
Volatility-Adaptive Trading:
→ Use oscillator strength to adjust position sizing (stronger = larger)
→ Consider reducing exposure when oscillator reaches extreme zones
→ Implement tighter stops during periods of oscillator acceleration
Combination Strategies:
→ Pair with volume indicators for confirmation of momentum shifts
→ Use with support/resistance levels for strategic entry and exit points
→ Combine with volatility indicators for comprehensive market context

ZVOL — Z-Score Volume Heatmapⓩ ZVOL transforms raw volume into a statistically calibrated heatmap using Z-score thresholds. Unlike classic volume indicators that rely on fixed MA comparisons, ZVOL calculates how many standard deviations each volume bar deviates from its mean. This makes the reading adaptive across timeframes and assets, in order to distinguish meaningful crowd behavior from random volatility.
📊 The core display is a five-zone histogram, each encoded by color and statistical depth. Optional background shading mirrors these zones across the entire pane, revealing subtle compression or structural rhythm shifts across time. By grounding the volume reading in volatility-adjusted context, ZVOL inhibits impulsive trading tactics by compelling the structure, not the sentiment, to dictate the signal.
🥵 Heatmap Coloration:
🌚 Suppressed volume — congestion, coiling phases
🩱 Stable flow — early trend or resting volume
🏀 High activity — emerging pressure
💔 Extreme — possible climax or institutional print
🎗️ A dynamic Fibonacci-based 21:34-period EMA ribbon overlays the histogram. The fill area inverts color on crossover, providing a real-time read on tempo, expansion, or divergence between price structure and crowd effort.
💡 LTF Usage Suggestions:
• Confirm breakout legs when orange or red zones align with range exits
• Fade overextended moves when red bars appear into resistance
• Watch for rising EMAs and orange volume to front-run impulsive moves
• Combine with volatility suppression (e.g. ATR) to catch compression → expansion transitions
🥂 Ideal Pairings:
• OBVX Conviction Bias — to confirm directional intent behind volume shifts
• SUPeR TReND 2.718 — for directional filters
• ATR Turbulence Ribbon — to detect compression phases
👥 The OBVX Conviction Bias adds a second dimension to ZVOL by revealing whether crowd effort is aligning with price direction or diverging beneath the surface. While ZVOL identifies statistical anomalies in raw volume, OBVX tracks directional commitment using cumulative volume and moving average cross logic. Use them together to spot fake-outs, anticipate structure-confirmed breakouts, or time pullbacks with volume-based conviction.
🔬 ZVOL isn’t just a volume filter — it’s a structural lens. It reveals when crowd effort is meaningful, when it's fading, and when something is about to shift. Designed for structure-aware traders who care about context, not noise.

Triple EMA + Volume/Price SignalsOverview
This script merges three exponential moving averages (EMA) with adaptive volume thresholds to identify high-confidence trends. Unlike basic volume indicators, it triggers signals only when volume exceeds both a user-defined absolute value (e.g., 500k) and a percentage increase (e.g., 5%) – reducing noise in volatile markets.
Key Features
Triple EMA System:
Short (9), Medium (21), and Long (50) EMAs for trend direction.
Bullish Signal: Short EMA > Medium EMA > Long EMA.
Bearish Signal: Short EMA < Medium EMA < Long EMA.
Dual-Threshold Volume Confirmation:
Absolute Volume: Highlight bars where volume exceeds X (e.g., 500,000).
Percentage Increase: Highlight bars where volume rises by Y% (e.g., 5%) vs. prior bar.
Users can enable/disable either threshold.
Customizable Alerts:
Trigger alerts only when both EMA alignment and volume conditions are met.
How It Works
Trend + Volume Synergy:
A bullish EMA crossover alone might be a false breakout. This script requires additional volume confirmation (e.g., 500k volume + 5% spike) to validate the move.
Flexibility: Adjust thresholds for different assets:
Stocks: Higher absolute volume (e.g., 1M shares).
Crypto: Smaller absolute volume but larger % spikes (e.g., 10%).
Usage Examples
Swing Trading:
Set EMA lengths to 20/50/200 and volume thresholds to 500k + 5% on daily charts.
Scalping:
Use 5/13/21 EMAs with 100k volume + 3% spikes on 5-minute charts.

Market Phase MAMarket Phase MA is an advanced trend-following indicator designed to provide traders with a dynamically colored moving average that adapts to market conditions. It uses a powerful combination of Average True Range (ATR) and Average Directional Index (ADX) to classify market trends in real-time. The indicator integrates a fully customizable moving average (SMA or EMA) to highlight trend phases clearly and effectively.
Key Features & Advantages:
✔ Adaptive Trend Classification: Detects uptrends, downtrends, and sideways markets using a refined mix of ATR and ADX for more precise trend identification.
✔ Color-Coded Moving Average: The moving average dynamically changes color based on trend classification, providing a clean visual representation of market sentiment.
✔ Advanced ATR & ADX Filtering:
- ATR measures market volatility and identifies ranging periods.
- ADX confirms trend strength, reducing false signals.
- A weighted approach balances ATR and ADX, ensuring reliability.
✔ Fully Customizable Moving Average: Traders can select between SMA and EMA while adjusting the moving average length directly from the settings panel.
✔ Smooth & Responsive Adjustments: The smoothing factor can be fine-tuned to control signal sensitivity and noise reduction, making it suitable for scalping, swing trading, and long-term trend monitoring.
What Makes It Unique:
- Unlike traditional trend indicators, Market Phase MA provides **direct visual feedback** on a moving average rather than using a separate oscillator.
- It **adapts dynamically** to market conditions instead of relying on fixed thresholds.
- The combination of **volatility and trend strength analysis** enhances precision in identifying valid trends.
- Users can optimize **reaction speed vs. reliability** with adjustable parameters for better decision-making.
How to Use It:
- Identify Market Phases: The moving average color shifts based on trend type—**teal** for uptrends, **red** for downtrends, and **gray** for sideways markets.
- Confirm Trend Strength: Persistent color shifts indicate strong trends, while frequent changes may suggest market indecision.
- Use as a Trade Confirmation Tool: Complement it with **support & resistance zones, price action analysis, and volume indicators** for stronger confirmation signals.
Market Phase MA is designed for traders seeking a clear, efficient, and highly adaptable moving average trend detection system. Whether you are a day trader, swing trader, or long-term investor, this indicator will help you identify and follow trends with confidence.
